Data Projects
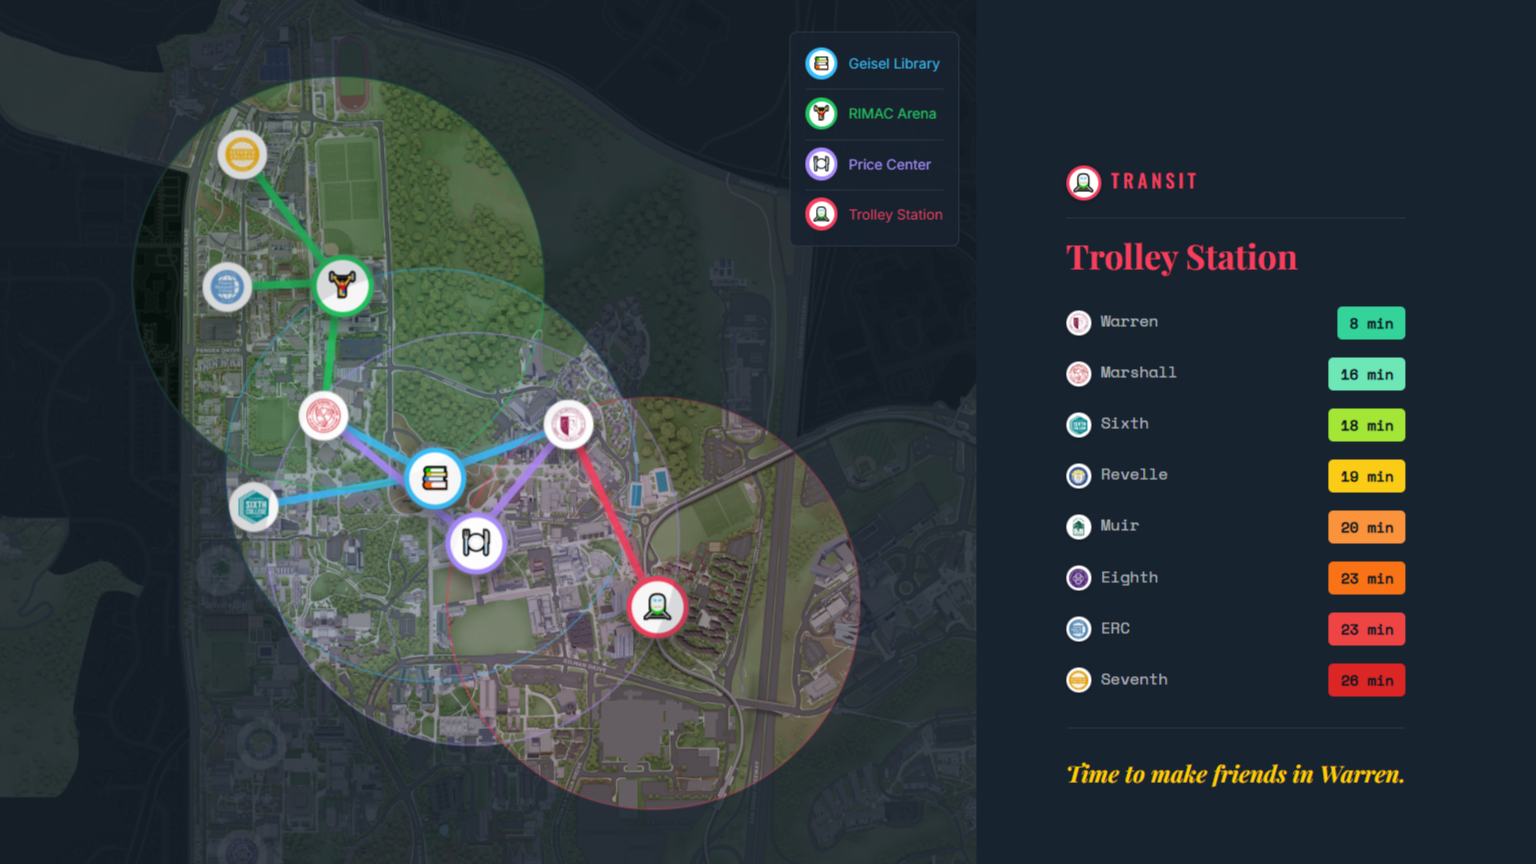
🔱 Is UCSD Walkable?
Is UCSD Walkable? is a scrollytelling data story exploring walking distances across UC San Diego's eight colleges, built with Leaflet, D3.js, and Scrollama, revealing how your college determines your relationship with everything on campus.
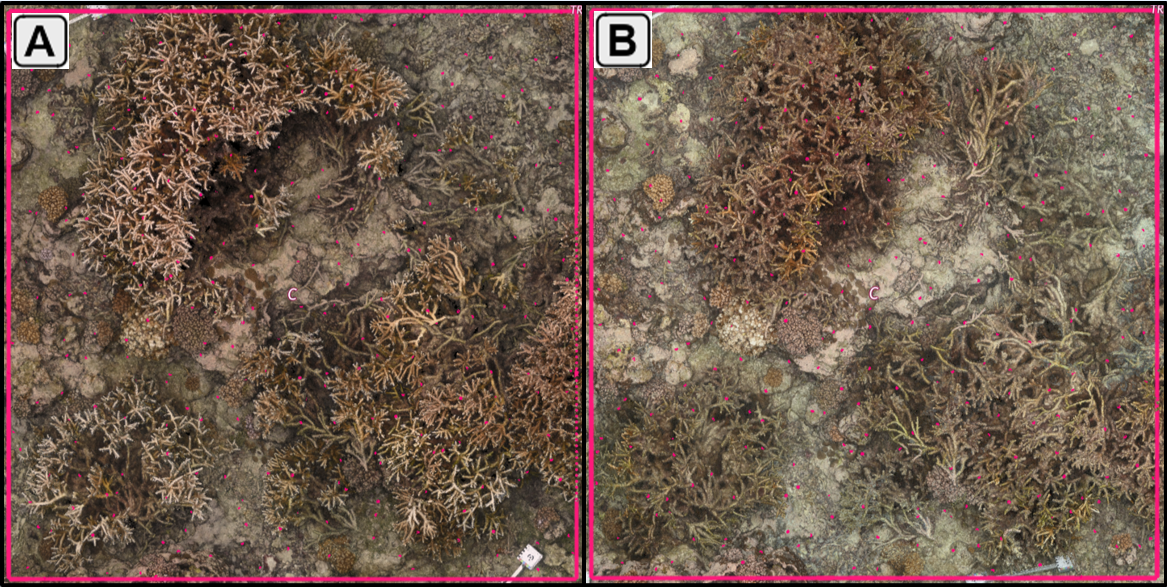
🐟 Palmyra Restoration Experiment
The Palmyra Restoration Experiment tracks a decade of benthic community monitoring across five coral restoration treatments at Palmyra Atoll, examining how transplantation design shapes long-term recovery trajectories and bleaching resilience through the 2023–2024 global coral bleaching event.
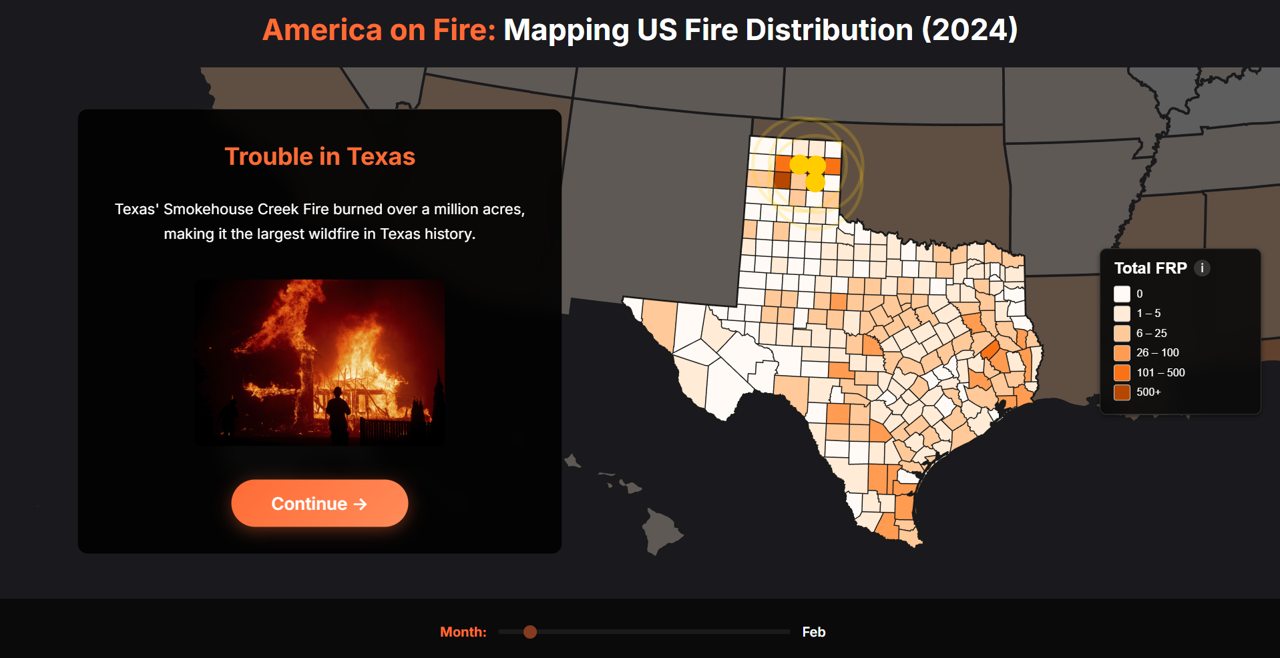
🔥 America on Fire
An interactive data visualization of U.S. wildfires in 2024 built with D3.js and NASA MODIS data, highlighting spatial patterns, seasonality, and unexpected hotspots.
Blog
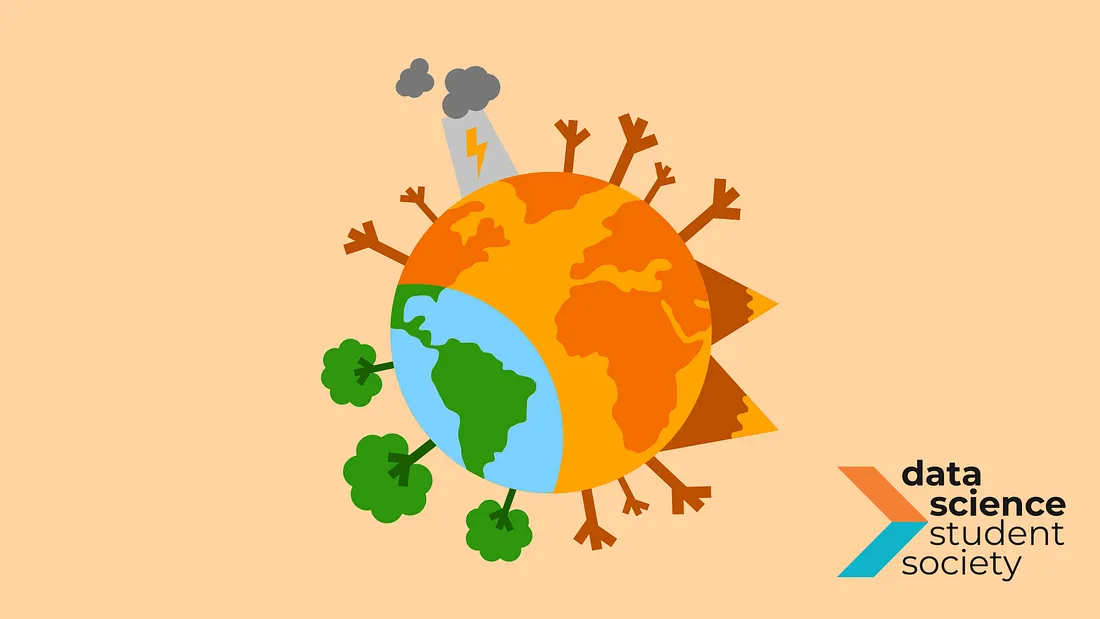
Predicting El Niño with ML
Leveraging decades of climate data to create ENSOcast, an accessible tool for understanding El Niño–Southern Oscillation.
Read More →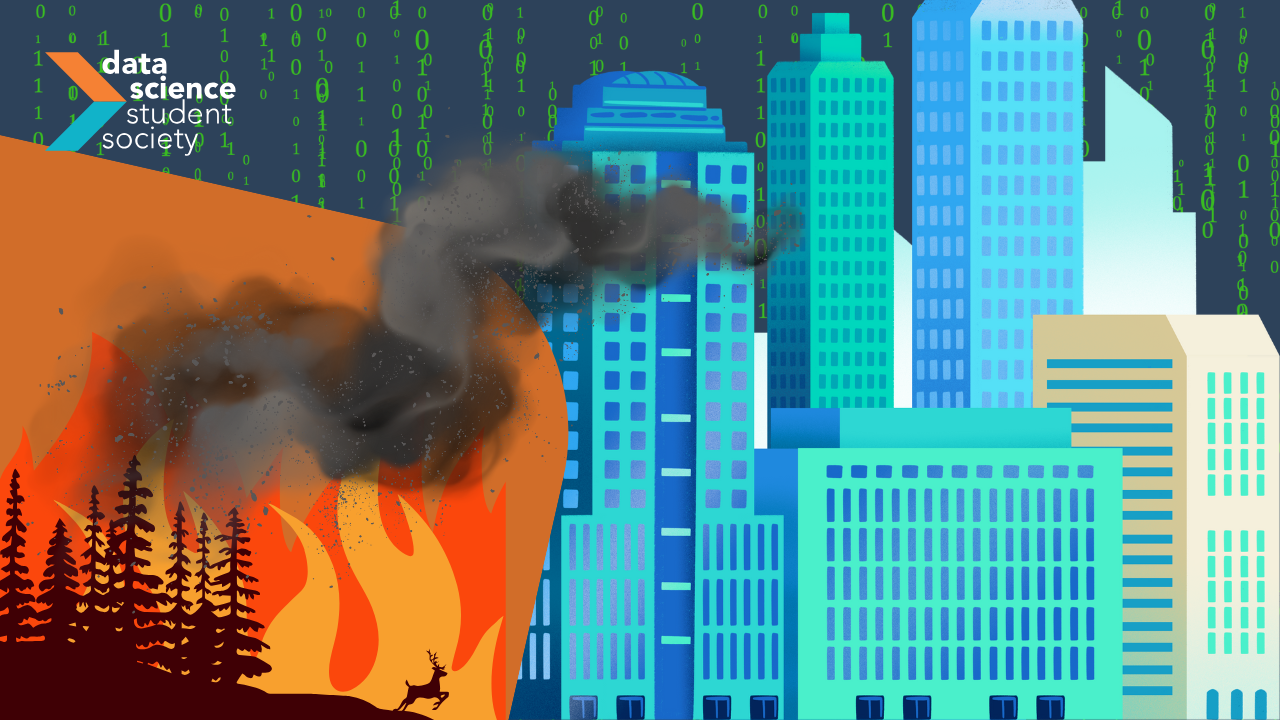
Data Science for Wildfire Management
Understanding how artificial intelligence can be leveraged to detect and predict wildfire spread within the United States.
Read More →
Rebuilding Coral Reefs with Data
Transforming coral reef restoration through predictive modeling and photomosaic technology.
Read More →Photography
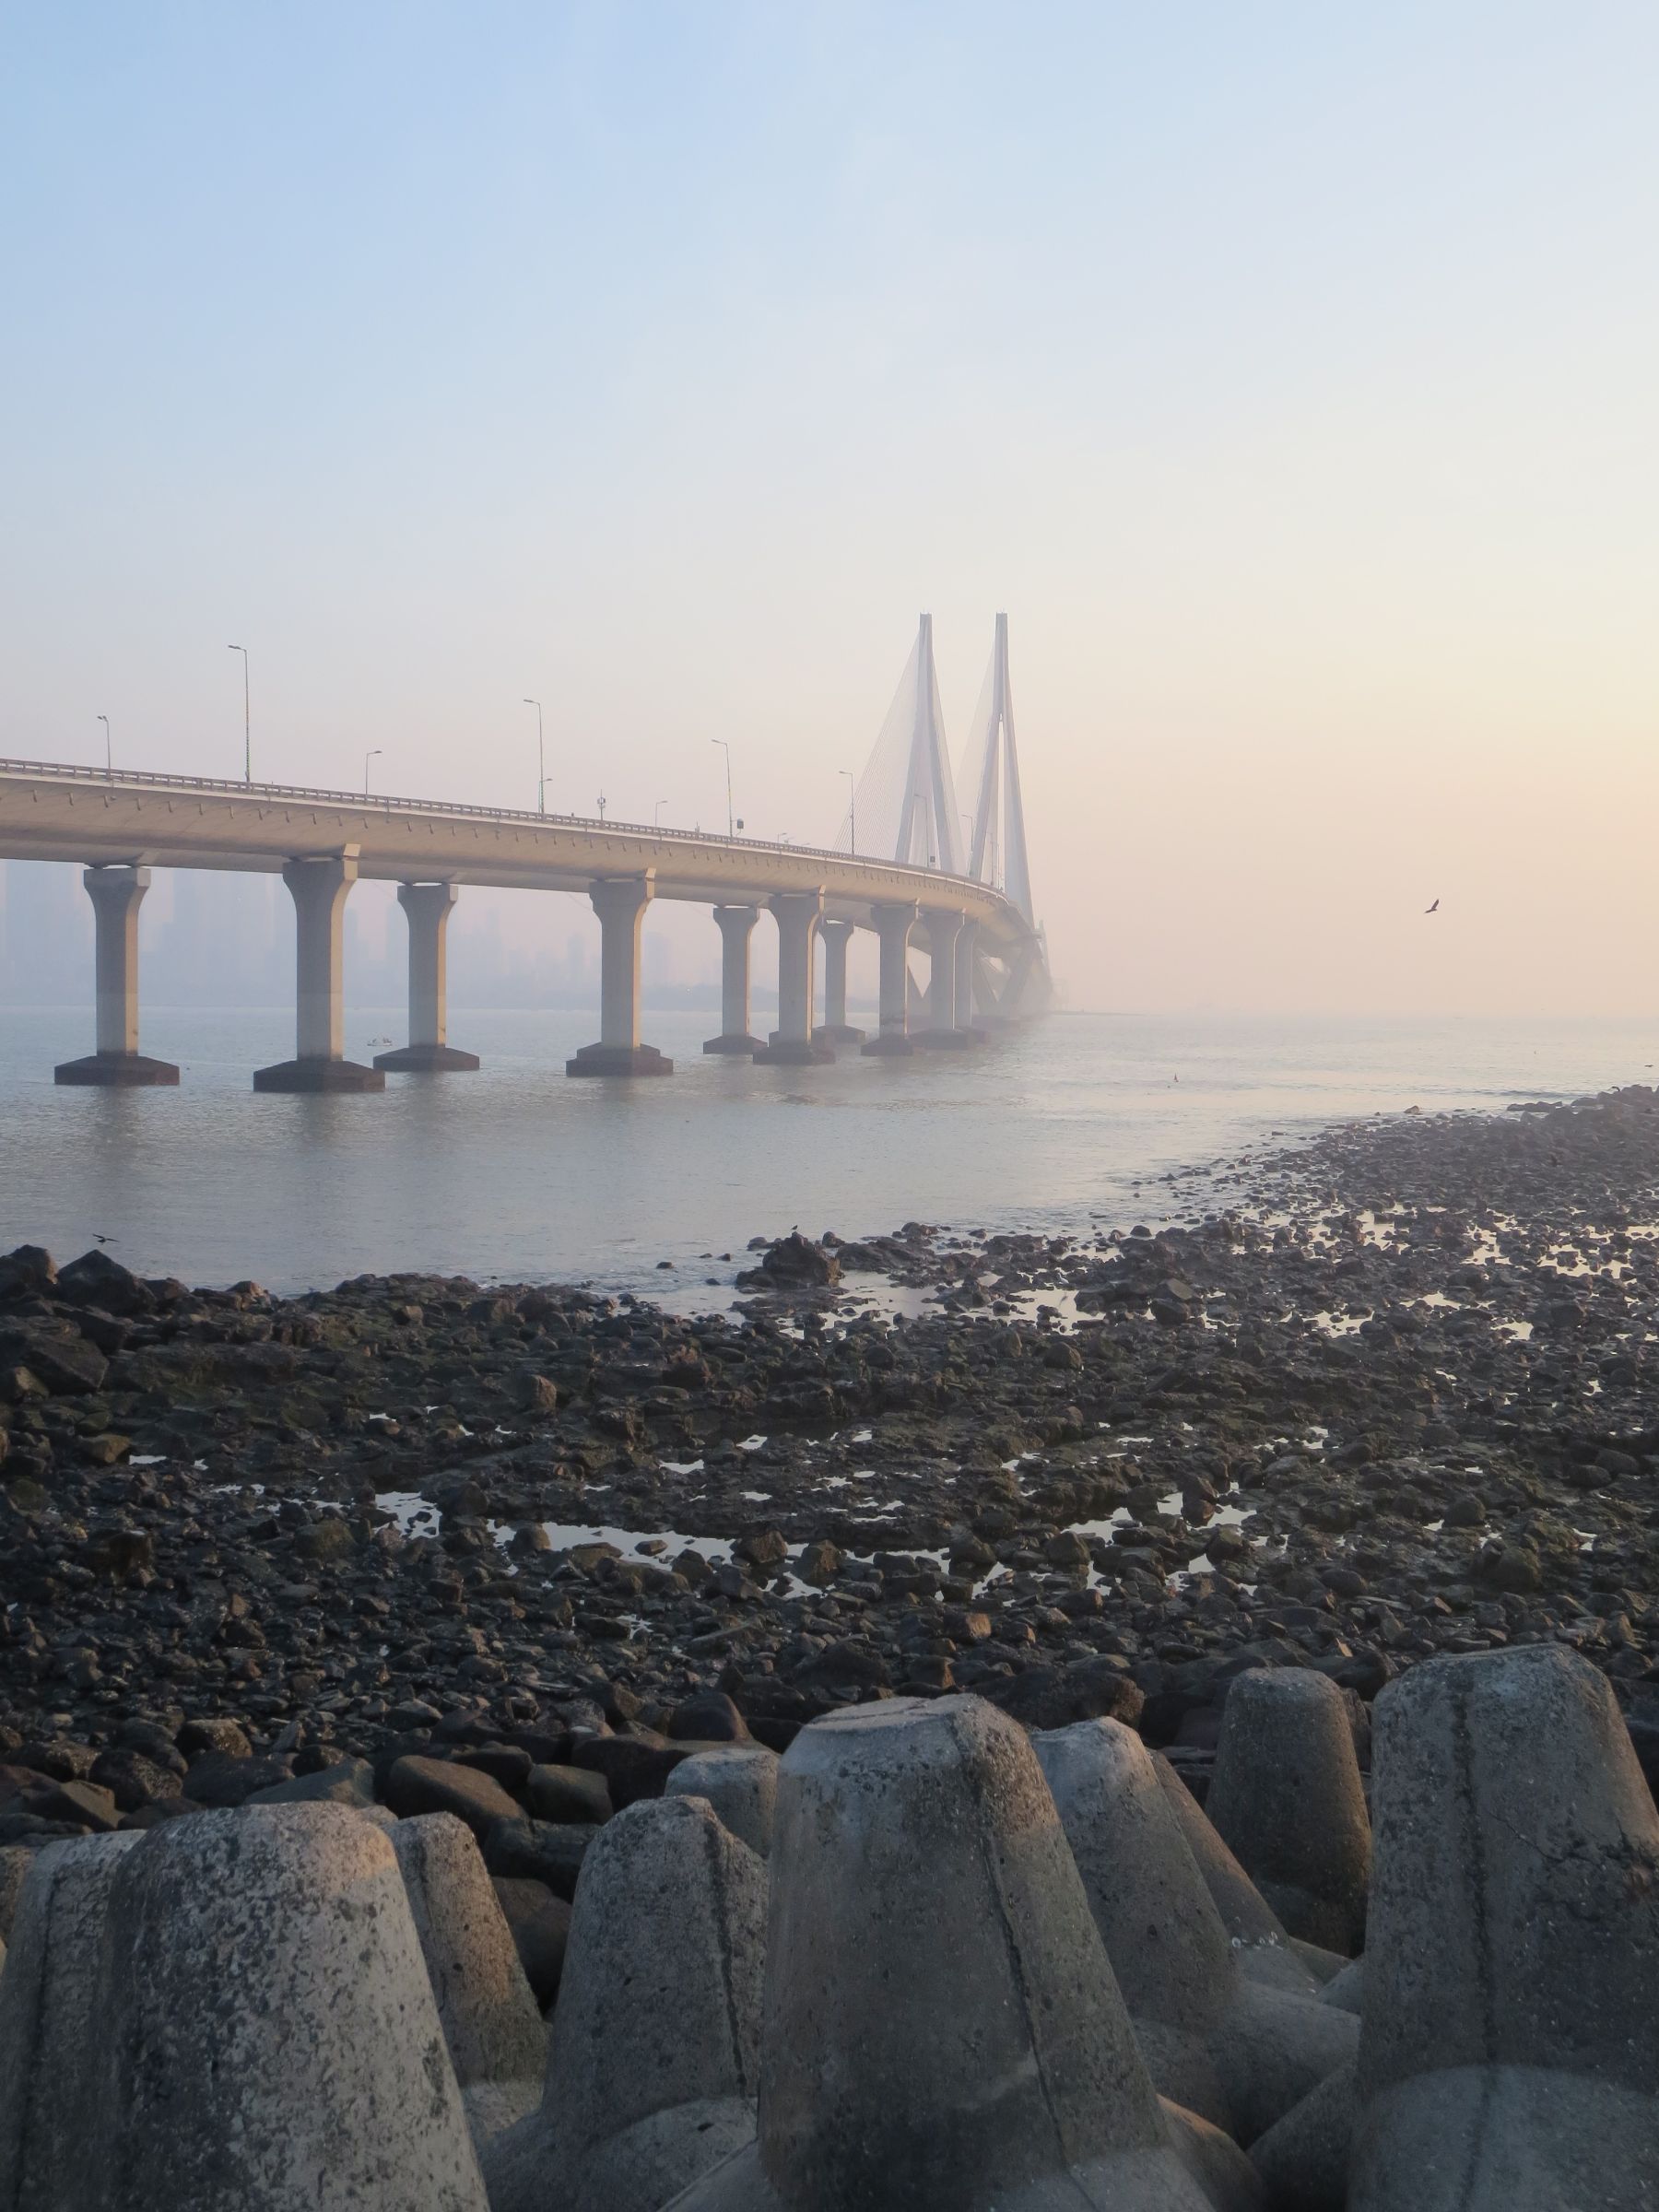
Bandra-Worli Sea Link
As morning mist weaves through the iconic bridge, the seamless union of city and sea comes to life.
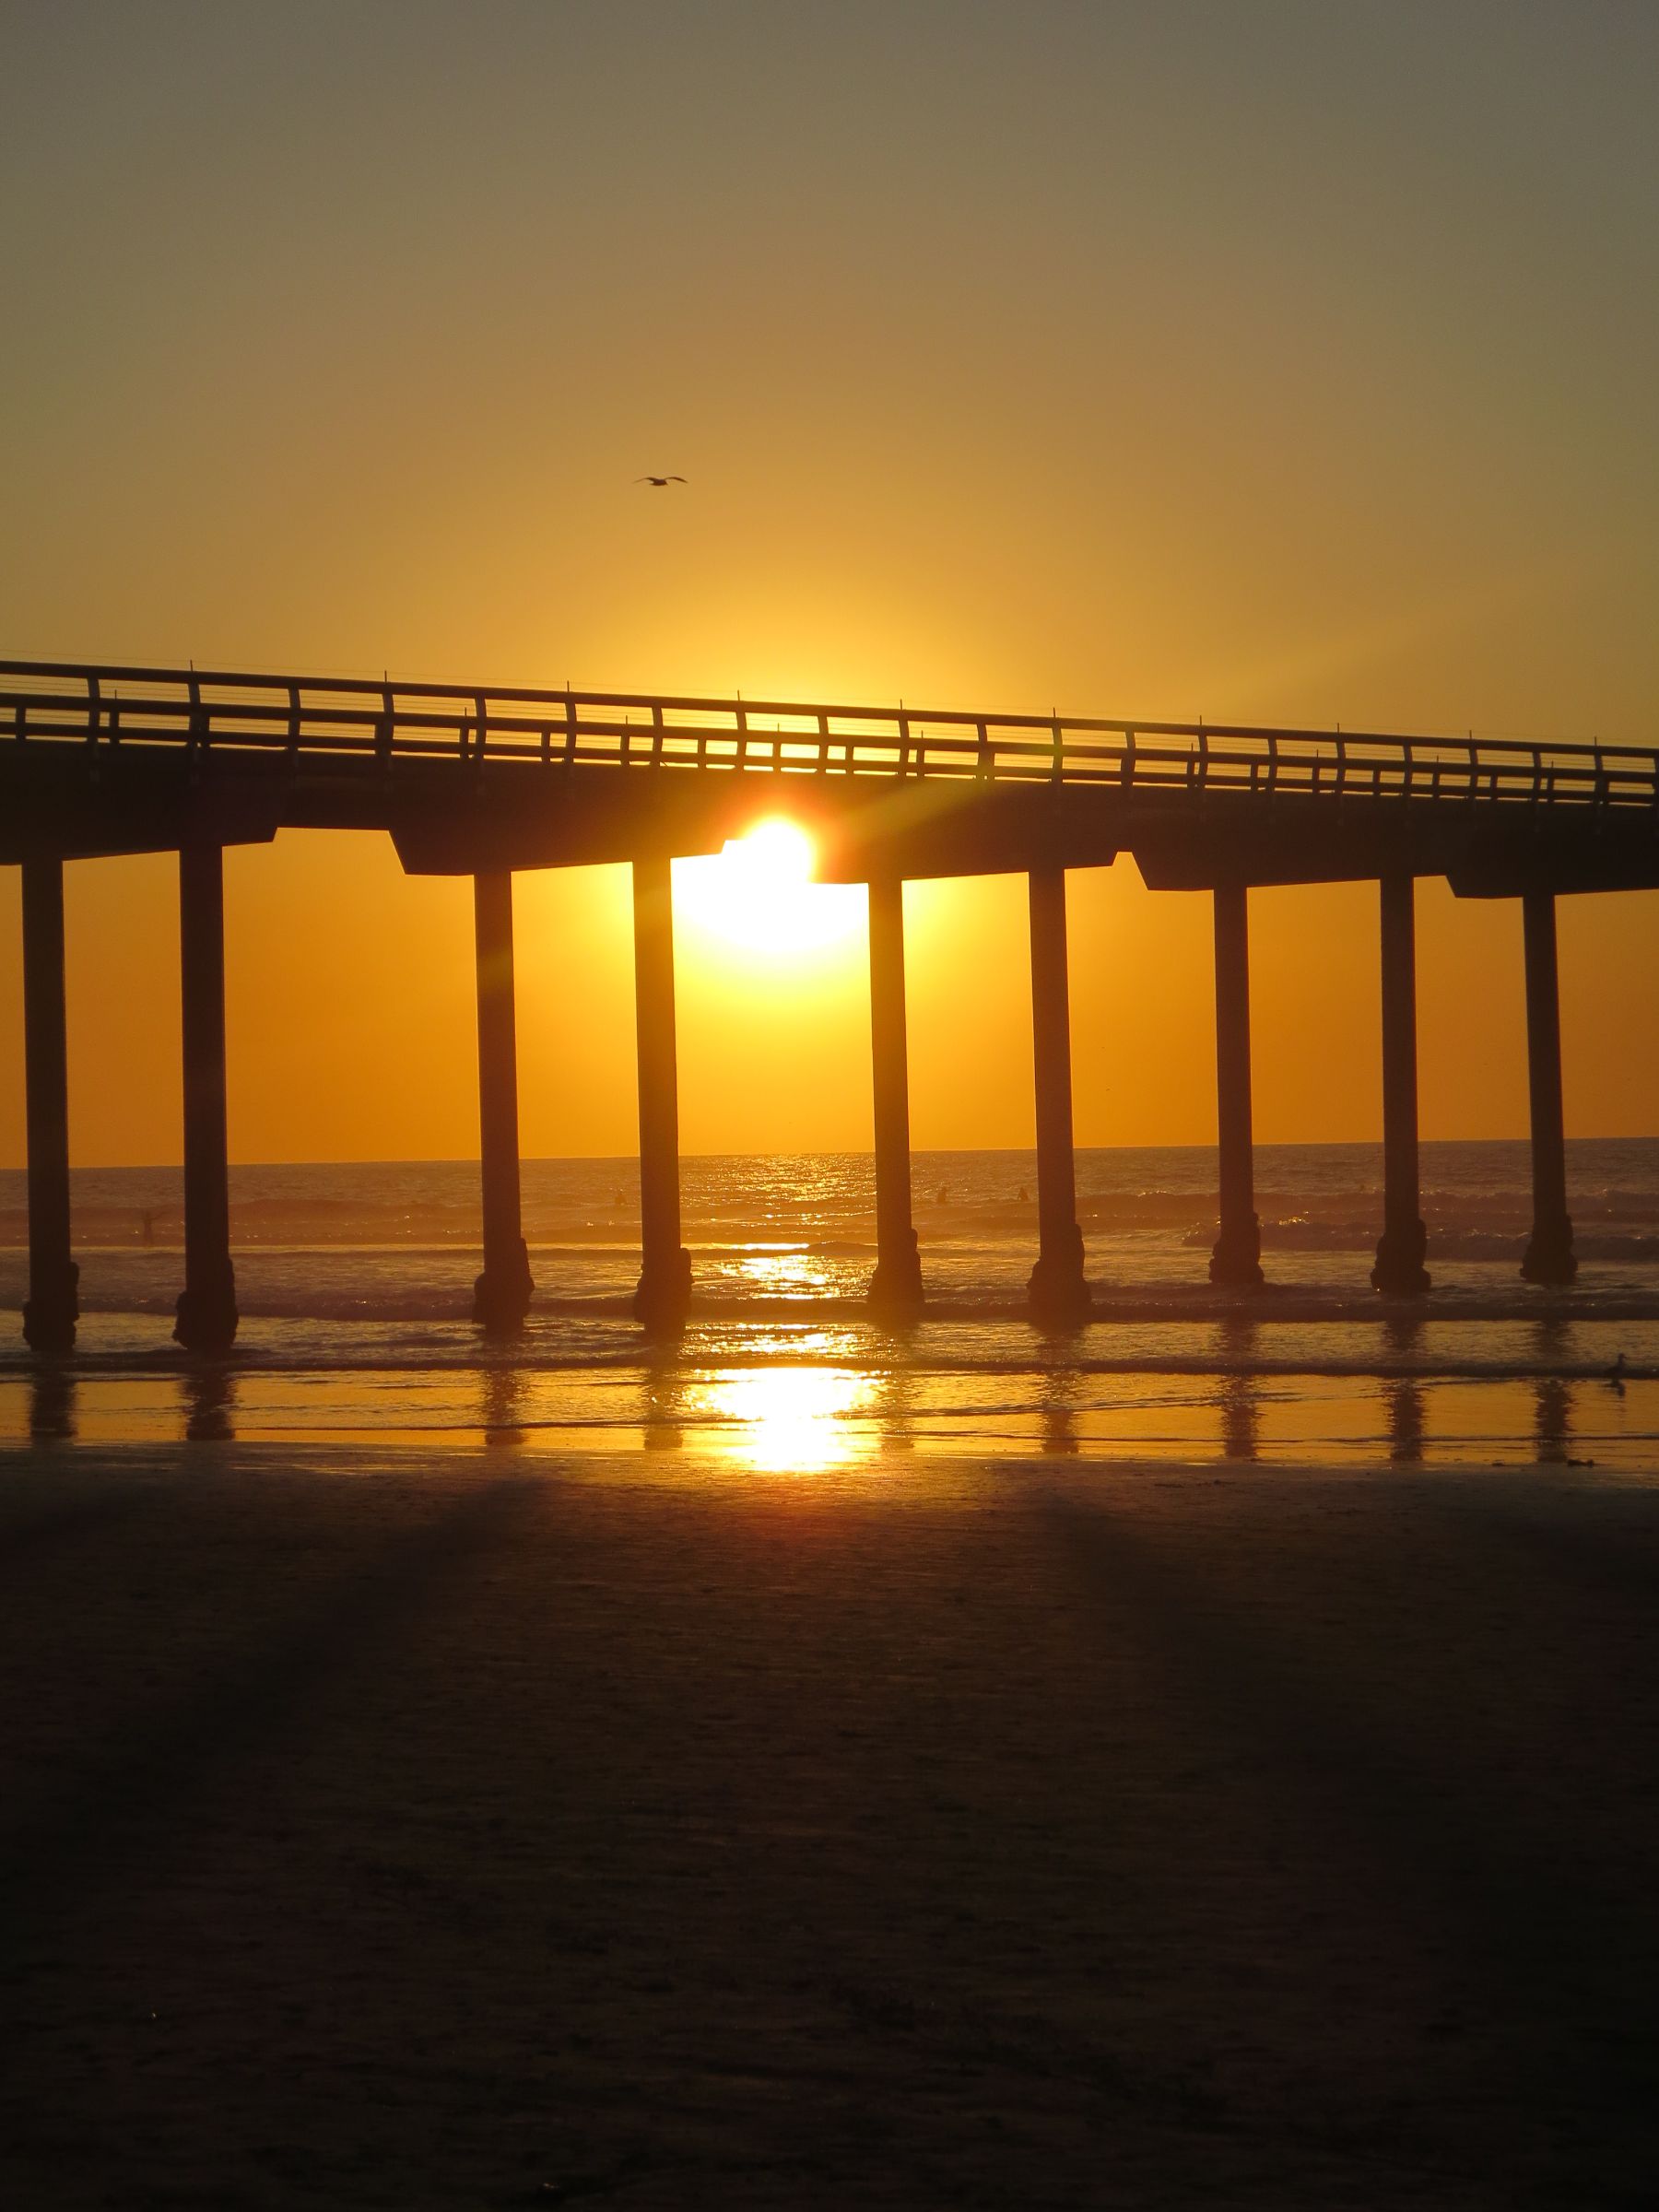
Scripps Pier
Nothing like the pier at golden hour. The light hits the water just right. Worth it every single time.
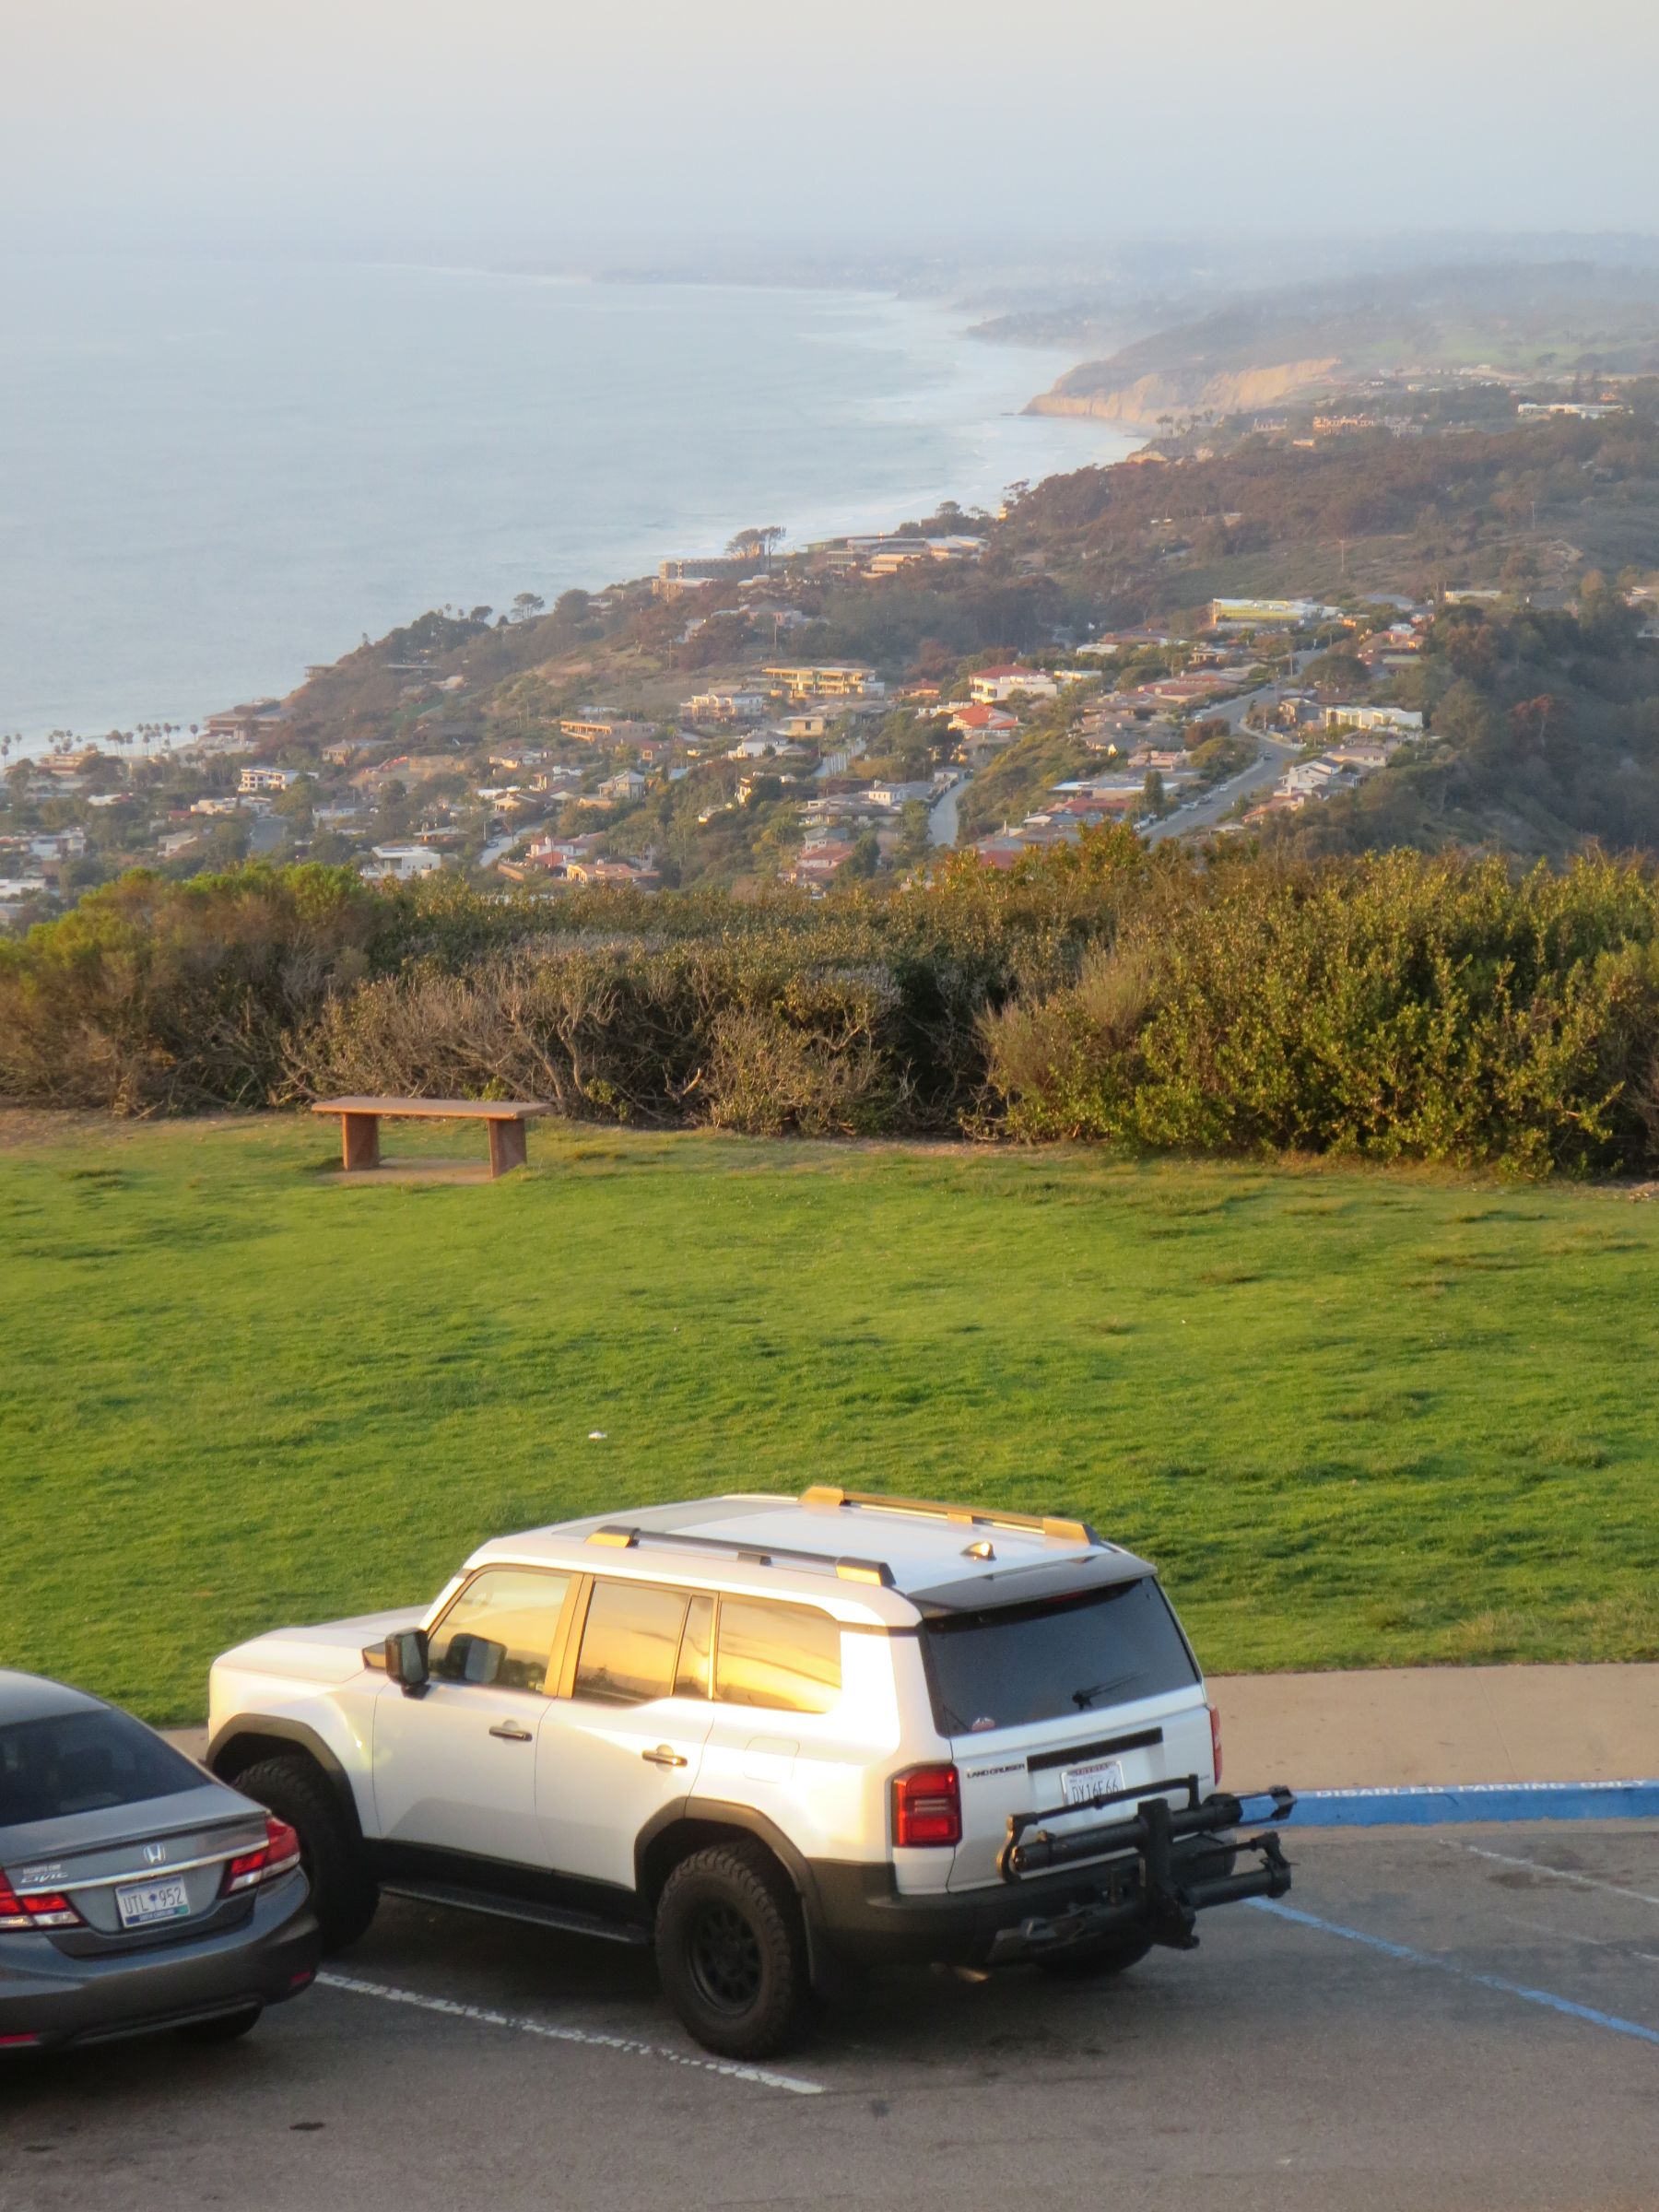
La Jolla Overlook
From the elevated slopes of Mount Soledad, the setting sun casts a warm glow over La Jolla.
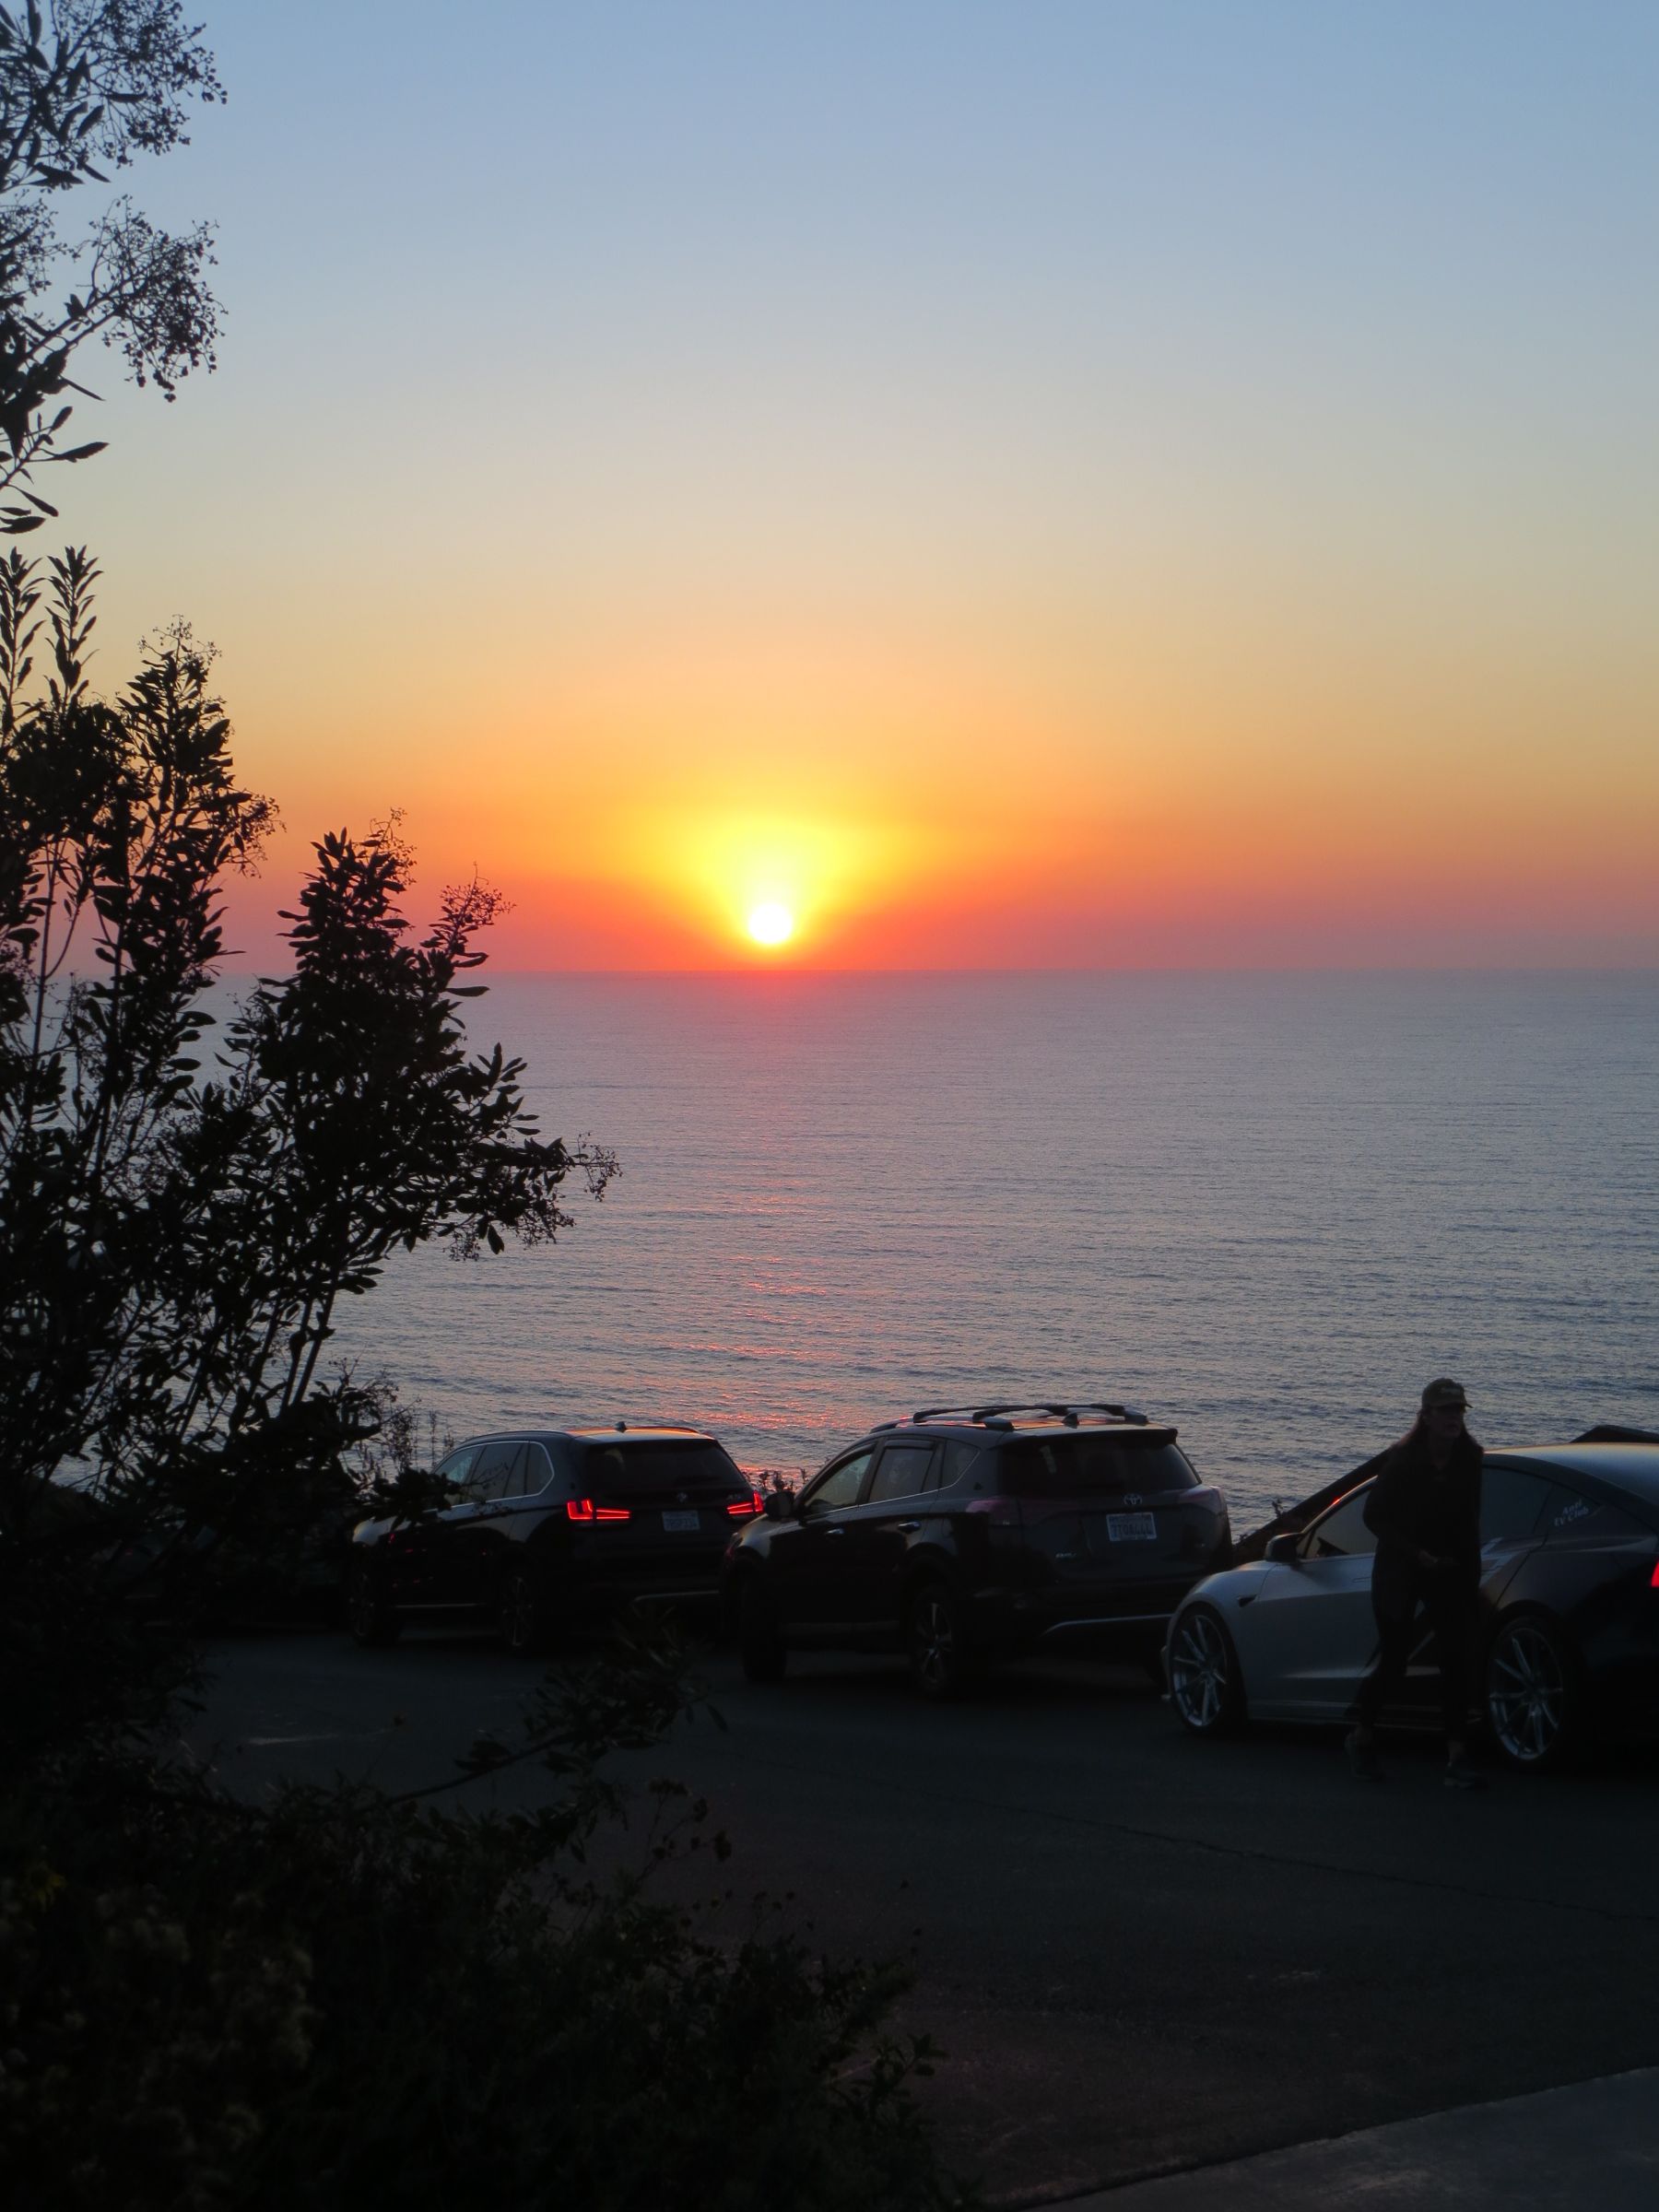
Sunset Pause
Cars parked, the Pacific Ocean in the background — a tranquil moment as the sun bids the day goodbye.
Get in Touch
Interested in my work or thinking of collaborating?
Feel free to reach out!