The Palmyra Restoration Experiment

Ten Years of Reef Recovery on a Remote Pacific Atoll

We tracked five coral restoration strategies across a decade of annual surveys โ€” right through the 2023โ€“2024 global coral bleaching event.

โ†“

The setting

One of the most remote reefs in the central Pacific.

Palmyra Atoll is an uninhabited coral reef ~1,000 miles south of Hawaii, established as a National Wildlife Refuge in 2001. It is one of the most well-managed reef ecosystems on Earth.

The disturbance

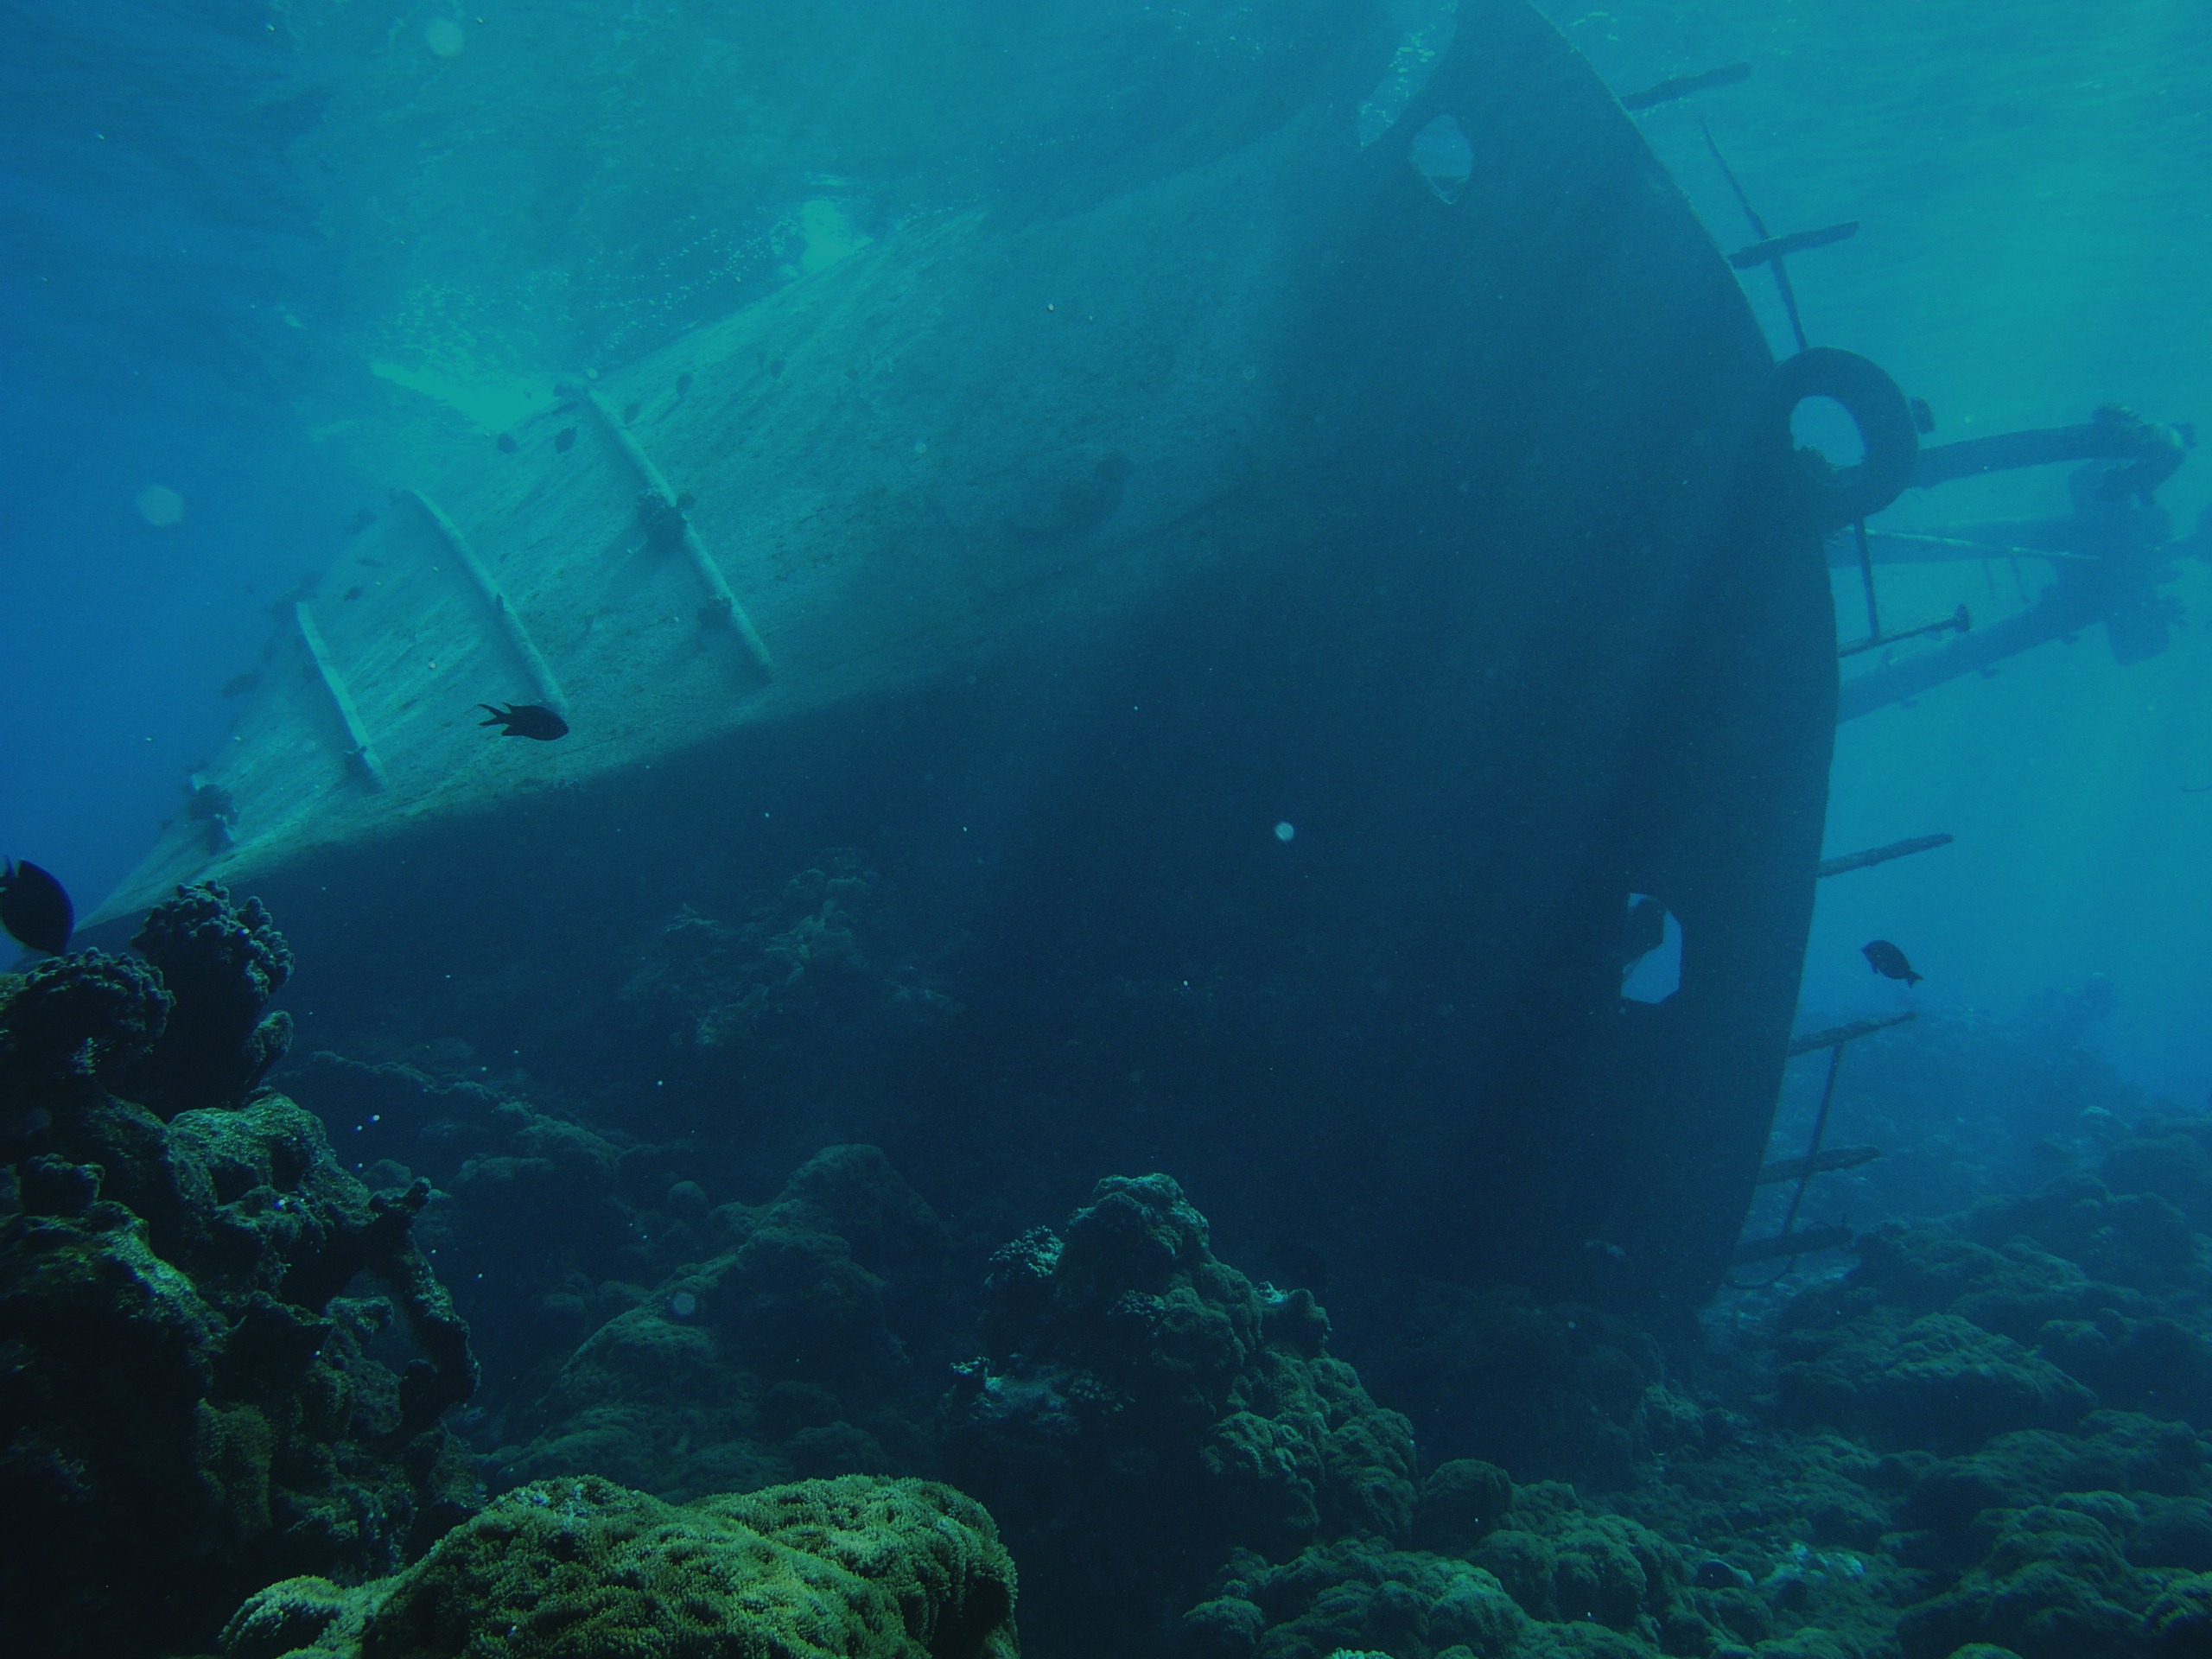
In 1991, a fishing vessel wrecked on the reef.

This disturbed the environment, and leached iron and nutrients into the surrounding water, corresponding with a mass outbreak of the invasive corallimorph Rhodactis howesii.

Shipwreck at Palmyra Atoll
Credit: USGS
The invader

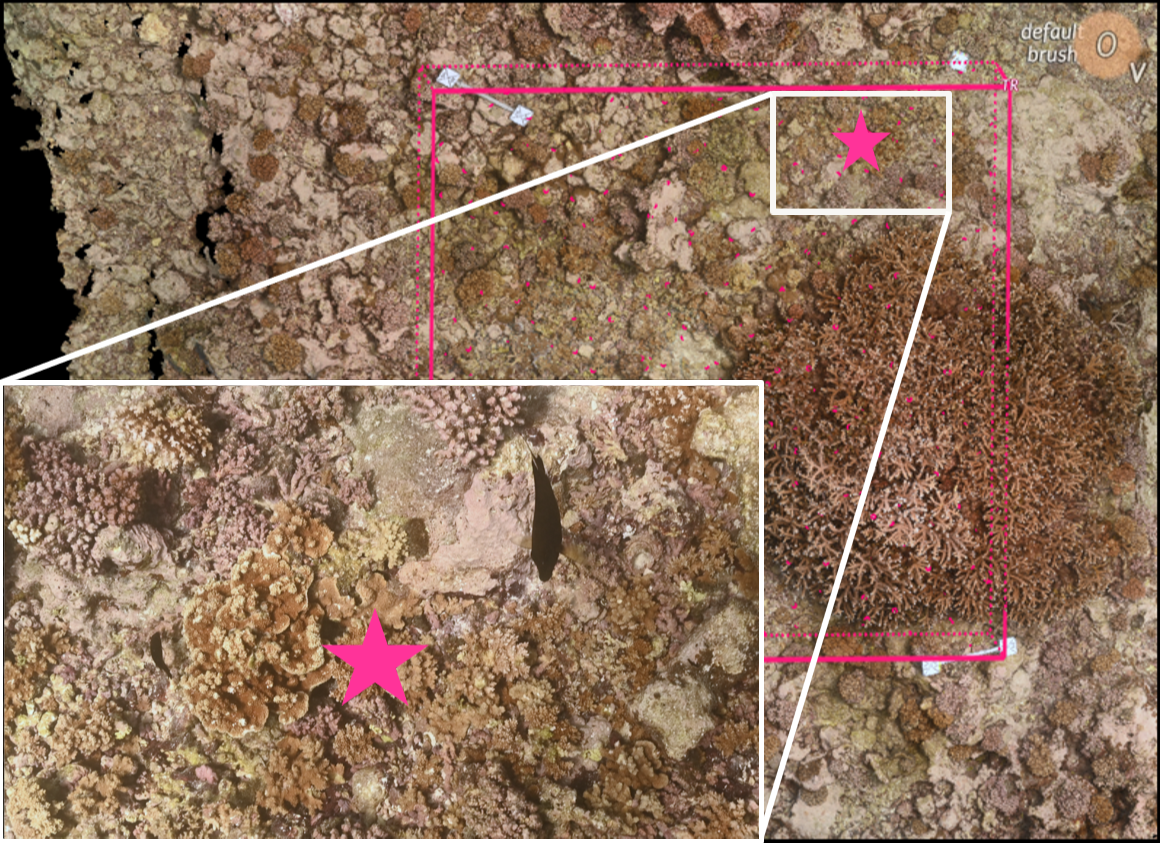
A cnidarian that restructures reefs.

Corallimorphs are fast-growing, adaptable cnidarians that can outcompete hard corals and crustose coralline algae (CCA), fundamentally restructuring the benthic community.

Rhodactis howesii corallimorph at Palmyra Atoll
Credit: USGS
The opportunity

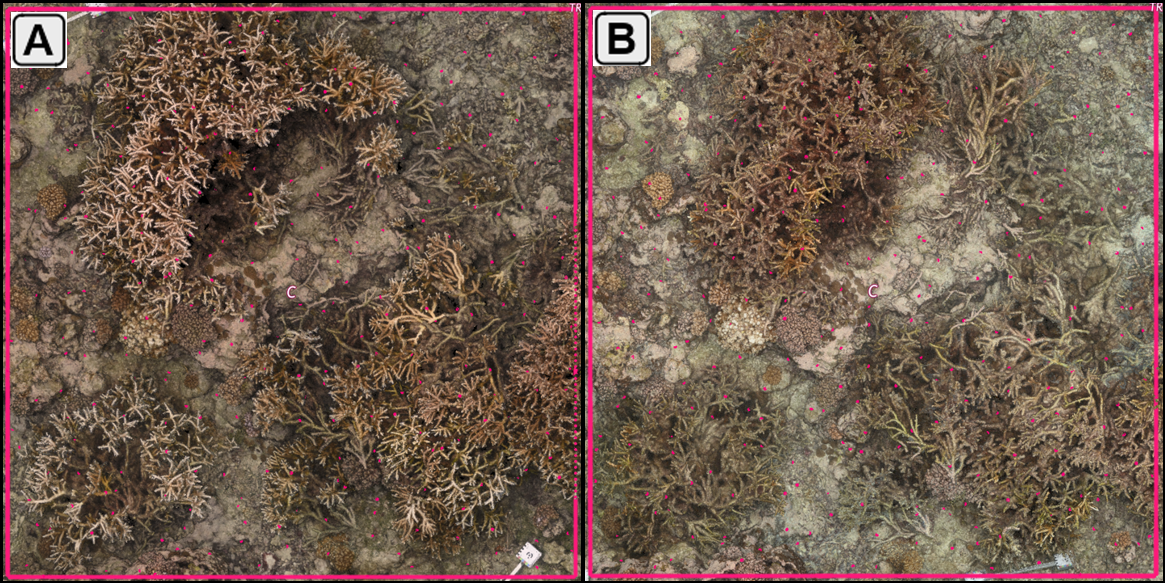
The wreck was removed in 2014.

This created a unique opportunity to implement experimental restoration strategies on a remote, well-managed reef.

We implemented five restoration strategies.

Fifteen 3ร—3 m permanent survey plots were established around the shipwreck scar and randomly assigned to one of five treatments (see below).

C-CON Control โ€” No Removal
No manipulation. Natural succession only.
C-REM Control โ€” Corallimorph Removal
R. howesii removed. No coral transplants.
All three transplant treatments included corallimorph removal and coral transplanting, but arrangements varied within each treatment:
T-BYSP Transplant โ€” By-Species
Removal + transplantation of Acropora, Montipora, and Pocillopora, grouped by species.
T-XSP Transplant โ€” Cross-Species
Removal + transplantation of Acropora, Montipora, and Pocillopora, mixed across species.
T-RAN Transplant โ€” Random
Removal + transplantation of Acropora, Montipora, and Pocillopora, randomly arranged.

How the data were collected

01

Annual photogrammetry surveys by divers captured ~1,000 images per plot, processed into 3D models using structure-from-motion (SfM) software (Agisoft Metashape).

02

Benthic composition was quantified using Virtual Point Intercept (VPI) analysis in custom software (Viscore), with ~30 stratified random points per mยฒ identified to the finest possible taxonomic resolution. The pink star indicates a Montipora colony.

Virtual Point Intercept analysis on a 3D photogrammetry model
03

Percent cover data were aggregated and standardized across all 13 survey timepoints using a custom Python pipeline, with all visualizations and statistical analyses conducted in R.

The Experiment, Year by Year

All Coral Mean ยฑ 1 SE
October 2015

The experiment begins.

Fifteen permanent plots were established around the shipwreck scar. With the corallimorph gone and the substrate bare, every treatment starts near zero coral cover in October 2015.

October 2015 โ€” September 2019

Treatment strategies begin to diverge.

Four years in, transplant plots are pulling well ahead. By 2019, all three transplant treatments exceed 15% coral cover while both control plots remain under 3%. This suggests that active restoration, not natural recruitment, is driving recovery.

September 2019 โ€” October 2023

Eight years of restoration transforms the reef.

By October 2023, all three transplant treatments exceed 30% hard coral cover: T-BYSP peaks at 40%, a tenfold increase from the baseline. Control plots reach ~13%, showing passive recovery is possible but slow. There is a distinct gap between active and passive restoration.

October 2023

The 4th global coral bleaching event strikes.

The 2023โ€“2024 global mass bleaching event โ€” the most severe on record โ€” begins to take effect on Palmyra. The October 2023 survey captures peak cover. What follows is collapse.

October 2023 โ€” September 2025

Transplant plots suffer losses, but remain ahead of controls.

By February 2024, transplant plots crash to ~10% coral cover, while control plots see a lower drop in coral cover. However, two years on, transplant plots remain above controls. This suggests that higher pre-bleaching coral cover may moderate post-bleaching decline.

Now it's your turn.

Select an organism and toggle treatments to compare.

Organism
Treatment
All Coral Mean ยฑ 1 SE

Benthic Community Composition
Across Treatments

Explore how 11 organism groups changed across treatments over time.

Timepoint
Bleaching event

What a decade of data tells us

01
Active restoration drove divergent benthic community trajectories over a decade โ€” Transplant and control plots diverged in coral cover, algal competitor abundance, and encrusting organisms, underscoring that restoration shapes the entire benthic community, not just target species.
Orthophotos of a representative transplant plot at peak coral cover in October 2023 (A) and post-bleaching in February 2024 (B)
Orthophotos of a representative transplant plot at peak coral cover in October 2023 (A) and following the onset of the 2023โ€“2024 global bleaching event in February 2024 (B), illustrating the rapid decline in coral cover across the study site.
02
Higher pre-bleaching coral cover may moderate post-bleaching decline โ€” Transplant plots entered the 2023โ€“2024 bleaching event with substantially higher cover and remained above controls through the most recent surveys.
03
Ecologically-informed, multi-species restoration supports reef resilience โ€” As global bleaching events increase in frequency and severity, restoration approaches that consider community succession and competitor dynamics will be critical for achieving lasting recovery.